Performance Comparison Between O and SPY

The housing market shoud have a different behavior than the stock market. In somme way it shoue be safer. In this article, I compare one of the best REIT option O to one the most represantable stock market ETF, SPY to find out if it is worth to include O in our portfolio in terms of downside risk protection and upside potential with tthe stock market.

 The full name of O is Realty Income Corporation and VNQ is SPDR S&P 500 ETF Trust.

APP

Tax Rate on Dividends:
Start Date:
End Date:

Simulate Random Date 100 Times

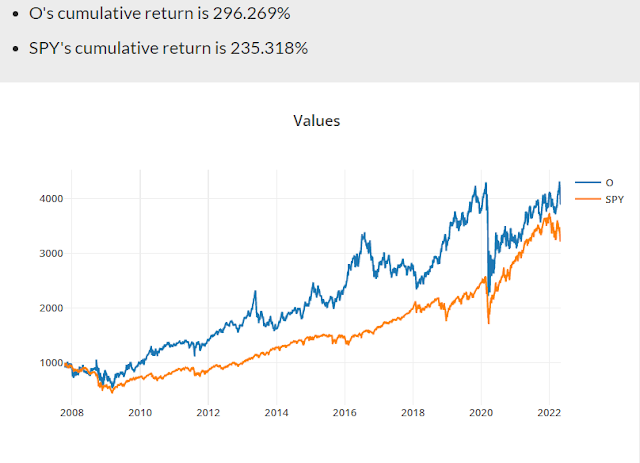
Investing During the 2008 Financial Crisis

O did better but with a higher volitility.

Investing During the 2020 Covid-19 crisis

O suffers more loses, which makes sense that a lot of O's assets have something to do we shopping and shoppeing is hit greatly by Covid.

Investing During the 2015 Fed's Rate Hikes

O did not do too good here.

Investing When S&P 500 hit bottom during Covid crisis

SPY grew faster than O.

Conclusion

I woudl stick with SPY for now.
Comments

Popular posts from this blog

Which Asset Class Had the Best Performance During the 2008 Financial Crisis?

In this article, I want to explore which asset, ETFs, MFs, Stocks, did best during the 2008 financial crisis. I will compare the investment results against the result of SPY, since it represents the overall market. The scenario is investing right at the highest point of S&P 500 index right before it crashed during the crisis. The date is Oct 9, 2007  when the index reached 1,565.15. I will compare the returns of each asset against SPY in the following order: Investing until the bottom of the crisis at 676.53 on Mar 09, 2009 in order to simulate downside risk. Investing until the S&P 500 index closed above the previous high at 1,568.61 on Apr 09, 2013 in order to simulate recover ability. Investing until the bottom of the Covid crisis at 2,304.92 on Mar 20, 2020 in order to simulate a series of market crashes. Performance By Ranks Oct 9, 2007 to Mar 09, 2009 SHY  return is 8.848% AGG  return is 7.390% LQD  return is -6.793% HYG  return i...