I frequently visit Yahoo Finance website. The reason is that it provides almot
complete historical stock data for which I use to build financial models. In
order to use the right data, I need to kwno the "Close price adjusted for
splits" and "Adjusted close price adjusted for splits and dividend and/or
capital gain distributions" that Yahoo Finance presents.

Close price adjusted for splits
If I would to use the historical prices that Yahoo Finance provides, I could
choose this column of data. But what does this mean?
Theoretically, if stock splite, it price should go down so that the total
capital of the company remains the same.
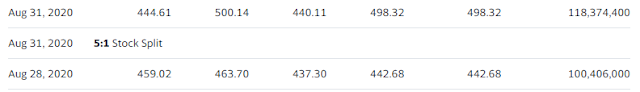
I search the company Tesla. It had a 5 for 1 stock split on Aug 31, 2020,
which means the stock price should be cut to 1 fifth. And what I have found
was that Yahoo Finance would adjust the price so just if the stock split has
never happeed.

Adjusted close price adjusted for splits and dividend and/or capital gain distributions
Now, let's take a look at the second to the last column of data which is
adjusted for both stock split and dividends.
I search SPY for answers.
What this column means is that if you use this column of data, you don't need
to calculate the reinvesment of dividends as if the stock does not pay out any
dividends.

Proof?
To quench my urge to continue looking for answer for the what "Adjusted close
price adjusted for splits and dividend and/or capital gain distributions"
means, I build an app to test if the data set with no adjustment for dividend
but with reinvestment would have the same result if I use the one with
adjustment.
Click on run, the system will pick a random date and compare for the result.
Conclusion
After playing with my own app, I am happy with the result that the adjusted closed prices at the 5th column provdided by Yahoo Finance already take care of dividends so I can use these date without doing the dividend reinvestment calculation.
Comments
Post a Comment